A sample prompt of what you can find in this page
Prompt by kjc9378

representing data prompts

very few results

8 months ago

High resolution photography interior design, dreamy sunken living room conversation pit, wooden floor, small windows opening onto the garden- [ ] A connected globe showing africa, suspended in a futuristic environment, is centrally positioned in the image. The globe is a deep blue, showcasing detailed landmasses and illuminated city lights. Interconnected lines and data points, representing global networks, are visible around and through the globe. The background depicts a futuristic cityscape, with towering buildings and a water feature below. The perspective is from slightly above the globe and the cityscape, and computer screens with data visualizations are seen in the foreground. A cargo ship and an airplane are visible on a transparent surface below the globe. The overall style is futuristic and high-tech. The colors are primarily blues, grays, and whites, with highlights of gold and light. A sense of global connectivity and technological advancement is evoked. Numerous charts, graphs, and data visualizations appear on surfaces and are layered to create a complex and detailed scene. Light sources in the background give an ethereal effect to the display. A small group of figures can be seen near the bottom right of the image, appearing like silhouettes. The composition is complex and layered, emphasizing the interconnectedness of elements., bauhaus furniture and decoration, high ceiling, beige blue salmon pastel palette, interior design magazine, cozy atmosphere; 8k, intricate detail, photorealistic, realistic light, wide angle, kinkfolk photography, A+D architecture

9 months ago

### **Image Generation Prompt for "Memory Me Objects Ka Behavior Kya Hoga?"** **Prompt:** Create a detailed and visually intuitive diagram to explain the behavior of objects in memory during a `while` loop that iterates over a database `ResultSet`. The diagram should include the following elements: 1. **Heap Memory Section:** - Show how new `User` objects are created in the heap memory during each iteration of the loop. - Highlight that each object corresponds to a row from the `ResultSet`. 2. **Garbage Collection:** - Illustrate how objects lose their reference after the loop ends and become eligible for garbage collection. - Use an arrow or icon to represent the Java Garbage Collector cleaning up unused objects. 3. **Permanent Storage (Optional):** - Show a scenario where objects are stored in a `List<User>` for permanent use. - Highlight the difference between temporary objects (eligible for garbage collection) and permanently stored objects. 4. **Flow of Execution:** - Include a flowchart-like representation of the `while` loop: - Start with `rs.next()` moving the cursor to the next row. - Show the creation of a new `User` object for each row. - End with either garbage collection or storage in a `List`. 5. **Annotations:** - Add labels and arrows to explain each step clearly. - Use Hindi/Hinglish annotations like: - "Har row ke liye naya object banega." - "Object ka reference lost ho jayega, to Garbage Collector clean kar dega." - "Agar List mei store kiya, to object permanent rehta hai." 6. **Color Coding:** - Use different colors for: - Heap memory (e.g., light blue). - Garbage-collected objects (e.g., grayed out). - Permanently stored objects (e.g., green). 7. **Database Table Example:** - Include a small table representation (e.g., `users` table with columns `id` and `name`) to show the source of data. --- ### **Expected Output:** The image should look like this: 1. **Top Section:** - A small database table (`users`) with rows and columns. 2. **Middle Section:** - A heap memory area showing multiple `User` objects being created during each iteration of the loop. - Arrows pointing from the `ResultSet` rows to the corresponding `User` objects in heap memory. 3. **Bottom Section:** - Two paths: - Path 1: Objects losing reference and being garbage collected (grayed out). - Path 2: Objects being stored in a `List<User>` for permanent use (highlighted in green). 4. **Annotations:** - Clear Hindi/Hinglish explanations for each step. --- This prompt will help generate a visually rich and easy-to-understand diagram for explaining the behavior of objects in memory! 😊

3 days ago

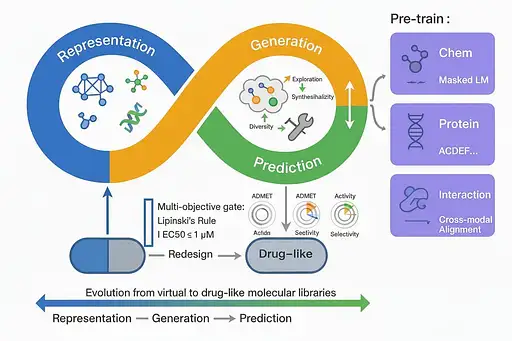
Scientific infographic illustrating an AI-driven closed-loop framework for virtual molecular library construction, showing the adaptive cycle of “Representation – Generation – Prediction – Feedback”. Central theme: artificial intelligence empowering drug discovery and molecular design. The diagram is a circular workflow structure centered on the AI virtual molecular library system. Left module: Representation Learning, visualized with neural network icons, molecular graphs, protein structures, and amino acid sequence symbols, representing molecular and protein feature embeddings. Upper-right module: Molecular Generation, showing diffusion or VAE-like model generating diverse small molecules, arrows indicating exploration of chemical space, novelty, and synthesizability constraints. Lower-right module: Property Prediction, containing ADMET, activity, and selectivity metrics represented by radar charts or data panels, feeding results back to the representation module to close the loop. Bottom section: Evolution from virtual to drug-like molecular libraries, shown as a smooth gradient arrow with multi-objective optimization icons balancing drug-likeness and diversity. Right-side branch: Pretrained models for new target ligand design, divided into three submodules—small molecule pretraining, protein pretraining, and cross-modal pretraining (protein–ligand interaction)—depicting embedding fusion or contrastive learning in shared latent space. No human figures, only abstract scientific symbols and molecular visuals. Style: flat vector scientific infographic, modern and minimalistic, clear logical flow, smooth connections between modules. Color scheme: blue for AI and representation, orange-yellow for generation, green for prediction; background light gray or white. Typography: clean sans-serif labels, concise annotations. High resolution (≥600 dpi), suitable for journal publication, ultra-clear, balanced layout, professional academic tone.