8 months ago An educational diagram illustrating the execution layers of the JavaScript engine. Layout Details: On the left side, a rectangle contains a block of JavaScript code written in a clear, readable font. To the right of the code, a large rectangle labeled "Web API", representing the asynchronous operations handled by the browser. Further right of the Web API, another rectangle labeled "Execution Stacks (Ordered by Priority)" contains four stacked rectangles representing different execution stacks: ✅ Call Stack (Topmost layer) console.log() Loops Function callbacks ✅ Micro Stack (Below Call Stack) Promises Await continuation queueMicrotask ✅ Rendering Stack (Below Micro Stack) DOM updates Rendering CSS changes requestAnimationFrame() ✅ Macro Stack (Bottom-most layer) setTimeout, setInterval I/O operations Network tasks (e.g., fetch API) To the right of these stacks, a circular arrow symbolizing the Event Loop, labeled "Continuously Checking & Executing Tasks". On the far right, a console output box displaying simulated JavaScript execution results. Color & Styling Preferences: Use soft, readable colors with clear text labels. Differentiate stacks using light shades (e.g., Call Stack in blue, Micro Stack in green, Rendering Stack in orange, Macro Stack in red). The Event Loop arrow should appear dynamic, visually emphasizing its continuous operation. Why These Enhancements? ✅ Better readability for students 🏫 ✅ More precise terminology 💡 ✅ Improved visual clarity 🎨 with 4k resolution 6518b4157eb 1 55
3 months ago A dramatic cinematic scene showing a confident man standing front and center, holding a large black rifle perfectly horizontal (180° flat) across his chest with both hands. The rifle is completely level — not tilted up or down — so the engraved glowing text “WATCH FREE MOVIES” appears clearly and straight, readable from left to right. His stance is strong, feet shoulder-width apart, wearing dark tactical gear, looking directly at the viewer. To his left: a powerful woman with wild hair, holding a futuristic flamethrower with flames sparking from the nozzle. To his right: a sharp-eyed woman in a leather outfit, holding a smoke grenade mid-pull with a sniper rifle slung on her back. The background is filled with roaring fire and thick smoke clouds swirling in the air. Color palette: intense reds, oranges, and deep smoky grays. High cinematic contrast, glowing embers, realistic lighting, and explosive atmosphere. Ultra-detailed, no other text. watchfreemovies 0 34
3 months ago A dramatic cinematic scene showing a confident man standing front and center, holding a large black rifle perfectly horizontal (180° flat) across his chest with both hands. The rifle is completely level — not tilted up or down — so the engraved glowing text “WATCH FREE MOVIES” appears clearly and straight, readable from left to right. His stance is strong, feet shoulder-width apart, wearing dark tactical gear, looking directly at the viewer. To his left: a powerful woman with wild hair, holding a futuristic flamethrower with flames sparking from the nozzle. To his right: a sharp-eyed woman in a leather outfit, holding a smoke grenade mid-pull with a sniper rifle slung on her back. The background is filled with roaring fire and thick smoke clouds swirling in the air. Color palette: intense reds, oranges, and deep smoky grays. High cinematic contrast, glowing embers, realistic lighting, and explosive atmosphere. Ultra-detailed, no other text. watchfreemovies 0 24
1 month ago YouTube thumbnail, 16:9, graphic design. Dark space/galaxy background in violet–indigo with soft nebula swirls, stars and slight vignette. Realistic gray moon on the right with a star-shaped light flare at its left rim. Left-aligned two-block headline: Top block (two lines): “NEUMOND MEDITATION” in ALL CAPS, bold sans-serif, lavender/purple (#C7A8FF) with a subtle drop shadow/outer glow. A thin white divider line below. Bottom block (larger): “INNERE HEILUNG & NEUANFANG” in white, bold italic, ALL CAPS, high readability. Layout: text occupies left ~60%, moon balances on the right; high contrast, crisp edges, HDR, clean modern look. b8fd5e3a917 PRO 0 19
1 month ago YouTube thumbnail, 16:9, graphic design. Dark space/galaxy background in violet–indigo with soft nebula swirls, stars and slight vignette. Realistic gray moon on the right with a star-shaped light flare at its left rim. Left-aligned two-block headline: Top block (two lines): “NEUMOND FREQUENZ” in ALL CAPS, bold sans-serif, lavender/purple (#C7A8FF) with a subtle drop shadow/outer glow. A thin white divider line below. Bottom block (larger): “Heilung BEGINNT - DER NEUANFANG” in white, bold italic, ALL CAPS, high readability. Layout: text occupies left ~60%, moon balances on the right; high contrast, crisp edges, HDR, clean modern look. b8fd5e3a917 PRO 0 20
1 month ago YouTube thumbnail, 16:9, graphic design. Dark space/galaxy background in violet–indigo with soft nebula swirls, stars and slight vignette. Realistic gray moon on the right with a star-shaped light flare at its left rim. Left-aligned two-block headline: Top block (two lines): “NEUMOND Frequenz” in ALL CAPS, bold sans-serif, lavender/purple (#C7A8FF) with a subtle drop shadow/outer glow. A thin white divider line below. Bottom block (larger): “Heilung beginnt & Der NEUANFANG” in white, bold italic, ALL CAPS, high readability. Layout: text occupies left ~60%, moon balances on the right; high contrast, crisp edges, HDR, clean modern look. b8fd5e3a917 PRO 0 15
8 months ago An educational diagram illustrating the execution layers of the JavaScript engine. Layout Details: On the left side, a rectangle contains a block of JavaScript code written in a clear, readable font. To the right of the code, a large rectangle labeled "Web API", representing the asynchronous operations handled by the browser. Further right of the Web API, another rectangle labeled "Execution Stacks (Ordered by Priority)" contains four stacked rectangles representing different execution stacks: ✅ Call Stack (Topmost layer) console.log() Loops Function callbacks ✅ Micro Stack (Below Call Stack) Promises Await continuation queueMicrotask ✅ Rendering Stack (Below Micro Stack) DOM updates Rendering CSS changes requestAnimationFrame() ✅ Macro Stack (Bottom-most layer) setTimeout, setInterval I/O operations Network tasks (e.g., fetch API) To the right of these stacks, a circular arrow symbolizing the Event Loop, labeled "Continuously Checking & Executing Tasks". On the far right, a console output box displaying simulated JavaScript execution results. Color & Styling Preferences: Use soft, readable colors with clear text labels. Differentiate stacks using light shades (e.g., Call Stack in blue, Micro Stack in green, Rendering Stack in orange, Macro Stack in red). The Event Loop arrow should appear dynamic, visually emphasizing its continuous operation. Why These Enhancements? ✅ Better readability for students 🏫 ✅ More precise terminology 💡 ✅ Improved visual clarity 🎨 6518b4157eb 0 63
9 months ago **"A structured, clean stack of ultra-thin, glossy RFID hotel room key cards, arranged in a perfect left-to-right fan-like layout. Each card is slightly overlapping the previous one, following a structured and evenly spaced pattern. The first card is rotated slightly for visibility and features a bold RFID door lock icon with sharp, high-resolution printed text reading: 'Unlock the Potential of Your Existing Room Key'. The remaining cards continue in a neat, sequential format, labeled with the following precisely formatted, perfectly aligned text: Breakfast, Lunch, Dinner, Spa Booking, E-Wallet, Complimentary Wine, Discount of 50%. The cards are credit-card sized (85.6mm × 54mm), thin, and have a smooth, high-quality plastic finish with rounded corners. The color scheme is gradient blue and violet, with a clean, luxury fintech aesthetic. The background is plain and minimalist, with no unnecessary reflections or excessive metallic effects. The text is perfectly readable, with no distortions or overlapping issues. 🔹 No thick plastic, no curved stacking, no deep perspective, no unreadable text, no random distortions, no extreme reflections."** AndreasAike 0 46
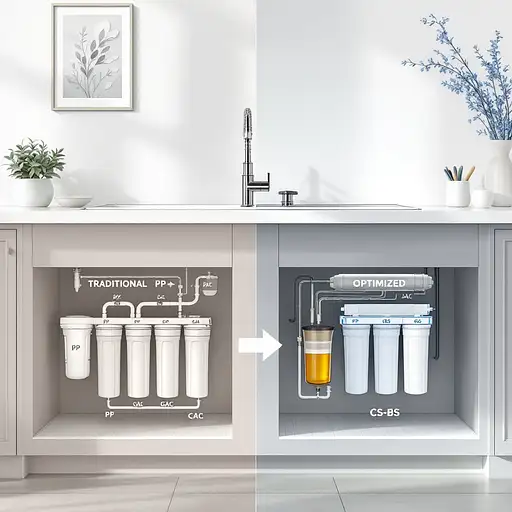
8 months ago A modern kitchen scene with a sink and countertop on the left, and a traditional multi-stage water filtration system (labeled PP, GAC, CAC, etc.) underneath the sink. On the right, show an optimized upgraded filtration system (labeled PP, GAC, CS-BS, etc.). Present the comparison in a clean, infographic style, highlighting the transition from traditional to optimized with arrows or visual indicators. Include text such as “Real water purification scene” to emphasize the real-world context. Use soft colors, 3D illustration feel, and ensure clarity and readability of labels. The overall design should convey a high-tech, professional look, possibly with 8K or photorealistic rendering. 5d684b8f385 0 50
8 months ago "A highly detailed, zoomed-in view of a Forex candlestick chart displaying a clearly defined Bullish Engulfing Pattern. The first candle is red (bearish), small, and represents a downward price movement. The second candle is a larger green (bullish) candle that completely engulfs the body of the previous red candle, symbolizing a strong reversal signal. The chart is set against a dark, sleek background with a modern, professional aesthetic. Chart Details: The chart includes thin, crisp support and resistance lines in white or light gray, with subtle transparency for a clean look. The timeframe (e.g., 1-hour or 4-hour) is displayed in the bottom corner, and the price axis is clearly labeled on the right side. Highlighted Pattern: The Bullish Engulfing Pattern is highlighted with a soft glow or outline in bright green to draw attention, while the rest of the chart remains slightly muted for contrast. Reversal Signal: A bold, upward arrow in neon green or gold is placed above the green candle, pointing upwards to emphasize the reversal. The arrow has a subtle shadow or glow effect to make it stand out. Additional Elements: Include minimalistic grid lines in the background for structure, and add a faint, futuristic holographic effect to the chart for a modern, high-tech vibe. Text Overlay: In the top-left corner, include the text ‘Bullish Engulfing Pattern – Reversal Signal’ in a bold, modern sans-serif font (e.g., Helvetica or Futura). The text should be white or light gray with a subtle shadow for readability. Color Palette: Use a dark blue and black theme for the background, with neon green accents for the pattern and arrow. The overall design should feel sleek, professional, and visually engaging. Lighting: Add soft neon lighting around the edges of the chart and subtle reflections to give it a polished, futuristic look. Mood: The image should evoke a sense of precision, opportunity, and confidence, appealing to traders and financial enthusiasts." 95ce8da5ca4 0 75